Coding Interview Questions for Data Scientist: Top 8
You cleared the machine learning round. You talked through regularization, you defended F1 over accuracy on an imbalanced churn model, and the interviewer nodded along. Then the shared editor opens, a table of employee salaries appears, and the instruction is one line: return the second highest one. The pause stretches past ten seconds.
That gap is what these interviews measure. A data scientist coding interview is not a LeetCode gauntlet. It probes a narrow set of skills: ranking rows in SQL without fumbling window functions, reasoning about time-ordered data, writing a statistical test in Python, cleaning a messy DataFrame, and implementing enough of a model's math to prove you know what the library does for you.
The eight questions below are grouped by skill family rather than difficulty. Each one signals something specific to the interviewer, and each has a predictable failure mode. You get the sample approach, the complexity note, and a practice prompt you can run this week. Work through them in order, or jump straight to the family that matches the job description you're targeting.
1. Second Highest Salary and the SQL Ranking Family
SQL outranks almost every other skill in this format, so it earns the first slot. The 2025 Stack Overflow Developer Survey reports SQL used by 58.6% of respondents and Python by 57.9%, with Python adoption up 7 percentage points year over year. Both numbers matter, because this question gets asked in whichever language the team works in.
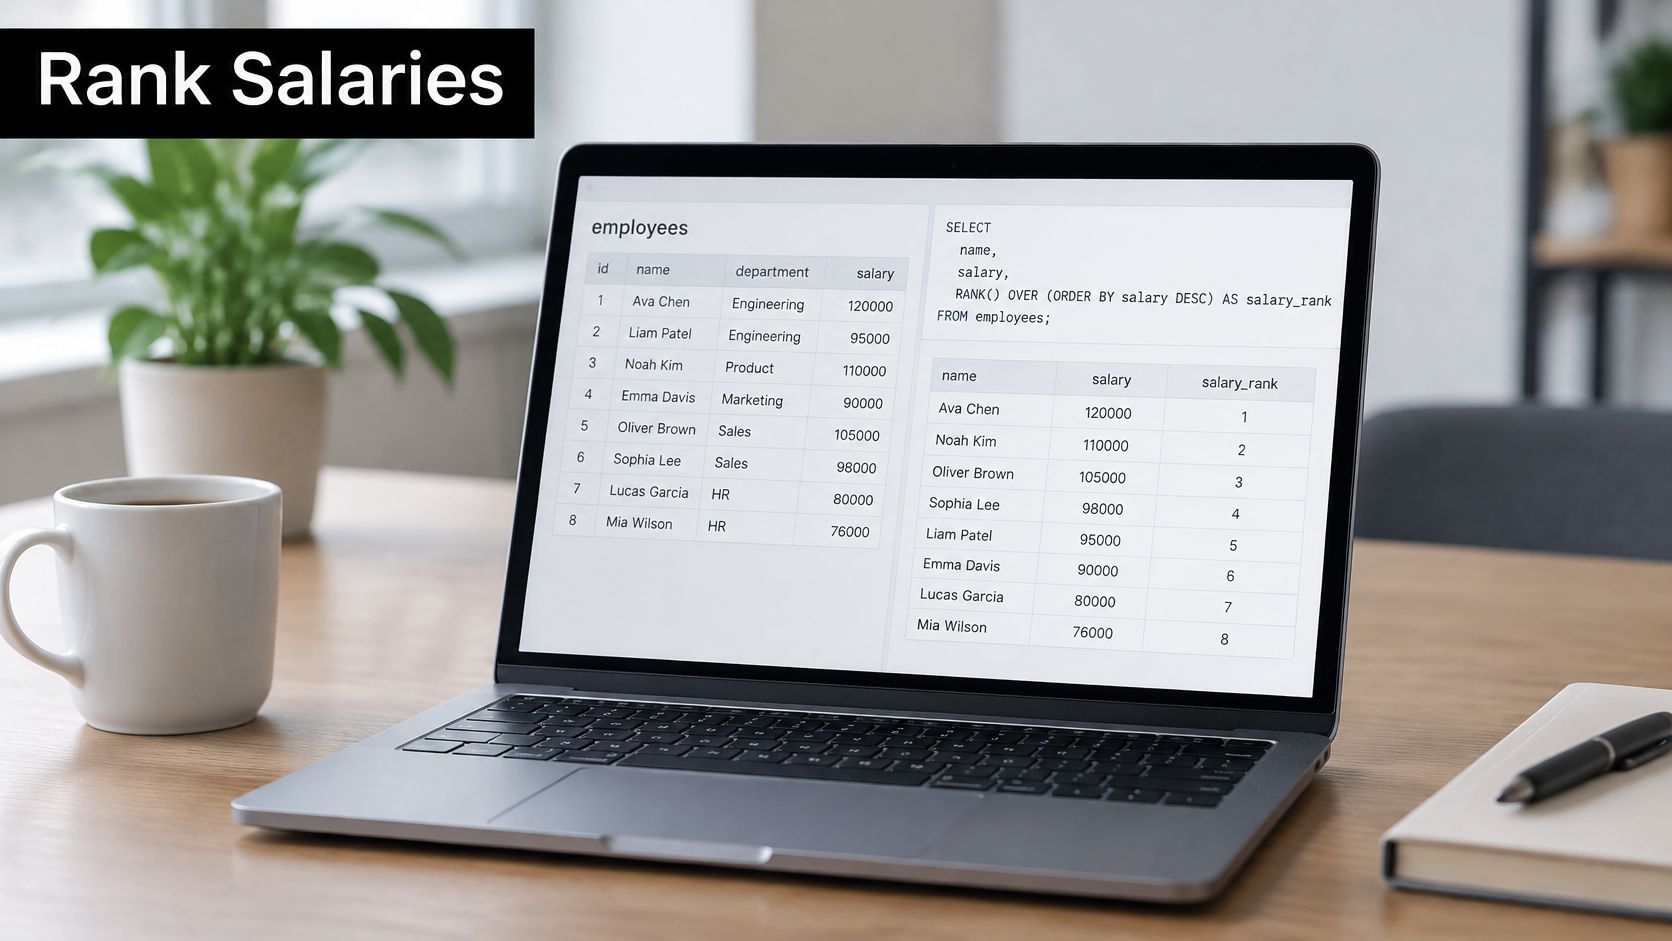
The prompt is short: return the second highest distinct salary from an employees table. The follow-up is where the test sits, either the top three earners per department or a parameterized nth highest.
The clean answer wraps DENSE_RANK() OVER (ORDER BY salary DESC) in a CTE and filters where the rank equals 2. For the per-department version, add PARTITION BY department to the OVER clause. One pass over the table, and the same skeleton handles any N.
What the Three Ranking Functions Signal
Ties expose whether you've thought the problem through. ROW_NUMBER() gives every row a distinct number, RANK() leaves gaps after tied values (1, 1, 3), and DENSE_RANK() does not (1, 1, 2). Interviewers ask for the difference as a follow-up almost every time, so have the one-line answer ready before you need it.
- Ask about duplicates before you type. Whether two employees on the same salary should produce one rank or two changes the entire query.
- Skip LIMIT 1 OFFSET 1 unless the table is tiny. It fails for per-group rankings and returns the wrong row when duplicate salaries exist.
- Watch NULL ordering. Some engines sort NULLs first under DESC, which shifts the rank you're filtering on.
The tell: a candidate who reaches for OFFSET without asking about ties is writing a query, not solving a problem.
If you want reps on the per-group variant, work through prompts grouped by company and topic in this question bank.
2. Rolling Averages and Moving Window Calculations
Ask for a 7-day rolling average of daily signups and you learn in two minutes whether someone has shipped a dashboard or only read about one.
In SQL the frame is explicit: AVG(signups) OVER (ORDER BY day ROWS BETWEEN 6 PRECEDING AND CURRENT ROW). In pandas it's df.rolling(window=7).mean(), and only after you reindex the frame to a complete date range.
The Bug That Hides in the Frame
ROWS BETWEEN 6 PRECEDING counts six rows of data, not six calendar days. If the table skips weekends, or if a quiet Tuesday logged no rows at all, your "7-day average" is really a seven-observation average. Say which one you're computing and why.
The warm-up period is the second trap. The first six rows have no full window behind them. In SQL you get a partial average unless you guard for it. In pandas, min_periods controls whether those rows come back as values or as NaN. Either choice is defensible, silence is not.
- Decide the missing-day policy out loud. Zero-fill, forward-fill, or leave the gap, and tie each option to the reporting question it answers.
- Set min_periods deliberately. df.rolling(7, min_periods=7).mean() rejects partial windows and makes the first valid output day seven, which is usually what a reporting table should show.
- State the grain. One row per user per day and one row per day produce different answers from the same function.
Practice prompt: a revenue table with gaps on days nobody purchased. Return a 7-day rolling sum, a 28-day rolling average, and a one-line note explaining how you treated the first rows and the missing dates.
3. Conversion Rate and A/B Test Significance in Python
Experimentation gets less airtime than most candidates assume. Across a dataset of more than 22,000 public interview reports, machine learning appeared in 25.8% of data scientist reports, SQL in 19.8%, statistics in 17.3%, and A/B testing in only 2.7%, according to Interview Query's data interview statistics. Treat that as a weighting signal for your study time, not permission to skip the topic, because product analytics and growth teams lean on it hard.
The question: given session counts and conversions for a control and a treatment group, compute conversion rates, relative lift, and whether the difference is significant.
A two-proportion z-test is the expected answer. statsmodels proportions_ztest takes the conversion counts and sample sizes and returns the statistic and p-value. Rebuilding the pooled standard error by hand, the square root of p_pool times (1 minus p_pool) times the sum of the reciprocal sample sizes, shows you understand what the library just did. Interviewers notice.
- Write the hypotheses first. H0 says the two conversion rates are equal. H1 says they differ, or that treatment is higher, depending on whether the test is two-sided.
- Read the p-value correctly. It's the probability of data at least this extreme if the null holds. It is not the probability that the null is true, and it is not the probability that you should ship.
- Say what the test ignores. Multiple comparisons, novelty effects, and peeking at results early all weaken a clean p-value.
The explanation carries as much weight as the code. Rehearse it aloud with an AI interviewer at this mock interview tool, because the distance between a correct answer and a convincing one lives entirely in the delivery.
4. Data Cleaning, Deduplication and Missing Value Handling in Pandas

Cleaning eats more of the working calendar than any modelling step, and interviewers know it's hard to fake. The Python Developers Survey 2024 reports that 51% of surveyed Python developers work in data exploration and processing, where pandas is used by 80% and NumPy by 75%, while Spark is used by 16%. A question set that skipped wrangling would miss most of the job.
Take-homes have tested this for years. A 2018 hiring account published by the American Statistical Association describes a 48-hour take-home task built to assess exploratory data analysis, critical thinking, work with real-world data, visualization, legible and commented code, and reproducibility through documented dependencies and complete source code.
The live version is a DataFrame with duplicate customer rows, inconsistent casing, missing ages, and dates stored as text. A strong answer normalizes email with strip and lower before dropping duplicates, imputes missing ages with the median within region, and adds an is_imputed flag so downstream analysis can separate guesses from observations.
- Inspect before touching. df.info() and df.isna().sum() take ten seconds and give you something concrete to say out loud.
- Keep the raw frame. Assign a copy, transform the copy, and describe each step as you go.
- Justify median over mean. Skewed distributions and outliers make the mean a worse guess, and saying that is the actual point of the question.
5. Linear Regression with Gradient Descent from Scratch
Machine learning questions appear in more than 85% of data science interviews, and the Interview Query breakdown of question types separates coding-skill questions on SQL and Python from technical-knowledge questions on machine learning, probability, statistics, A/B testing and database design. This question sits in both camps at once.
The task: implement linear regression with NumPy only. Write the cost, compute gradients, update weights for a fixed number of epochs.
Compare Against sklearn Before You Declare Victory
Fit sklearn's LinearRegression on the same data and compare coefficients and intercept. A discrepancy of a fraction of a percent is optimization noise. A sign flip or a coefficient three times off is a bug in your gradient.
- Standardize features first. Unscaled inputs make the loss surface long and thin, and gradient descent crawls along it. Print the loss every few hundred epochs; a flat curve means the learning rate is too small, a rising one means it's too large.
- Write the gradient before the loop. For MSE with predictions Xw + b, the weight gradient is (2/n) times X transpose times the residual. Getting the sign wrong produces a model that diverges while you debug in the room.
- Add L2 and explain the tradeoff. Penalizing squared weights shrinks coefficients and reduces overfitting, at the cost of some bias.
The follow-up is usually "why do this instead of calling sklearn?" The answer isn't speed. It's that you can explain what the optimizer is doing when a model refuses to converge.
6. Sessionization and User Activity Streaks
A representative prompt hands you user session logs and account metadata and asks for users with at least three sessions during the 30 days before churn, where churn means no session in the following 30 days, as in this KORE1 data scientist question set. It tests joining, time windows, event counting, and a business definition all at once.
Three Steps Before Any SQL
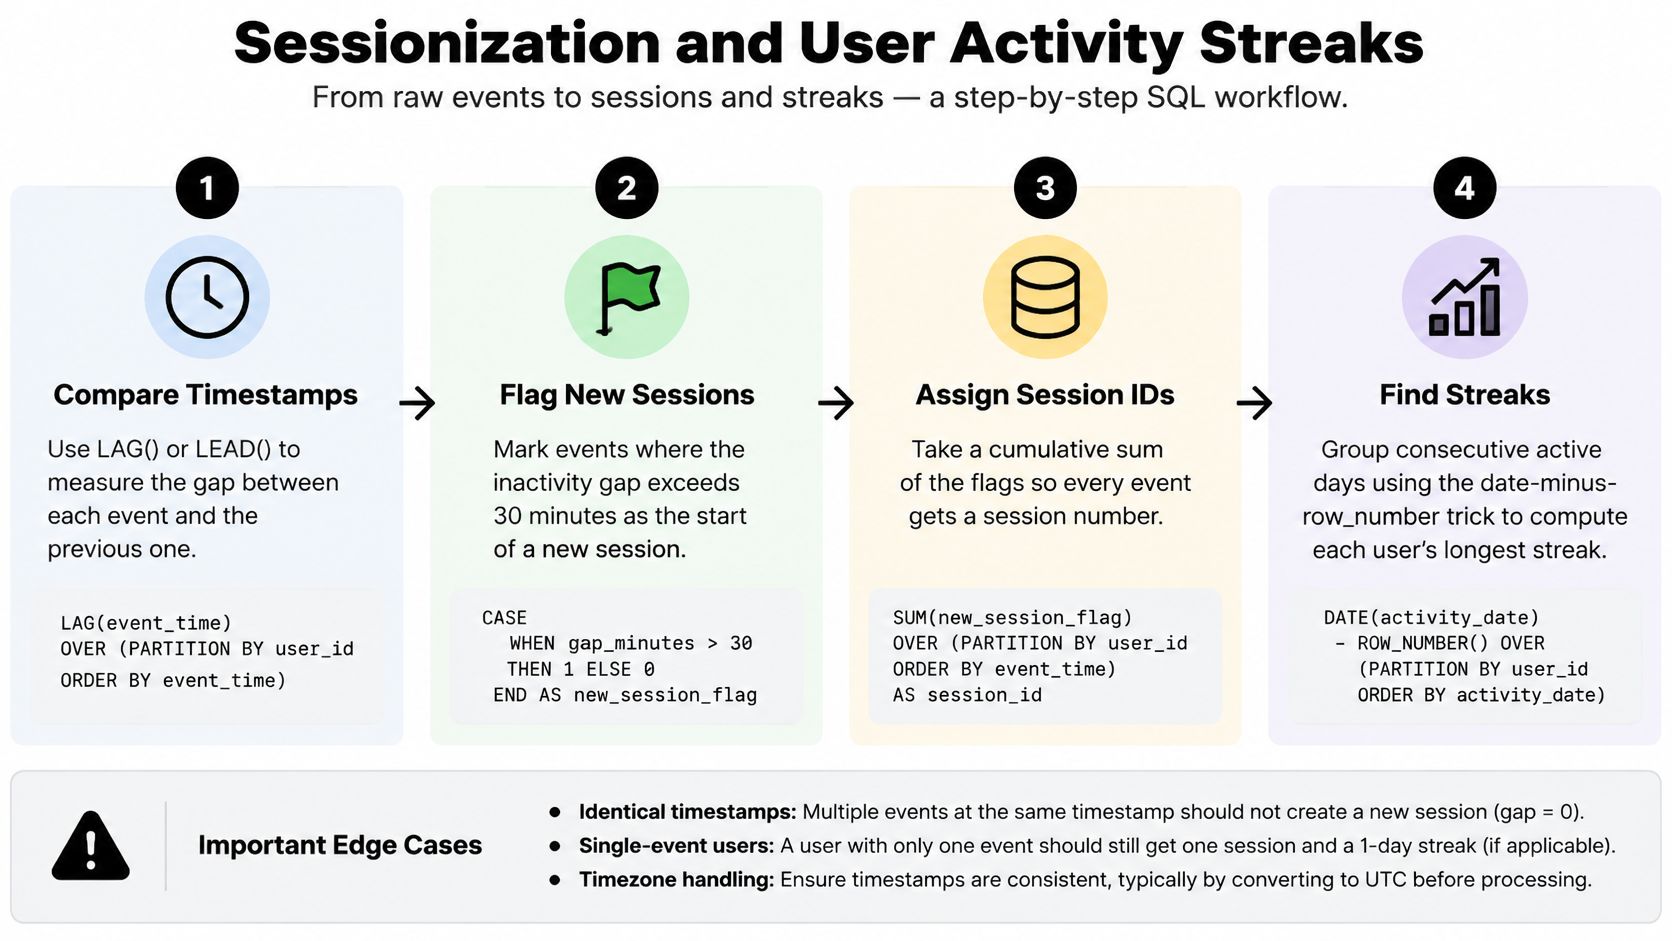
Compute the gap from the previous event with LAG, flag a new session when that gap exceeds the threshold, then take a running SUM of the flag. That cumulative sum is the session ID. Counting sessions per user and filtering to the churn window is ordinary aggregation on top.
For streaks, the trick is date minus ROW_NUMBER() over each user's ordered active dates. Consecutive days produce a constant, so grouping by that constant and counting gives you each run's length.
- Ask about the timezone and the threshold. Whether 30 minutes exactly counts as the same session changes the count you return.
- Build a five-row example by hand. The first event for each user has no previous row, and that edge case surfaces immediately.
- Name the churn definition back to the interviewer. Half the lost points here come from using the wrong window.
Write the three steps as comments before you type a single line. The interviewer grades the plan as closely as the query.
7. Top K Frequent Items with Hash Maps and Heaps
Technical elegance alone won't carry this one. Interview guidance describes interviewers assessing reasoning through ambiguity, clear explanation and connection to business outcomes, alongside SQL, Python, statistics and machine learning, as this Yale careers guide to data science interviews sets out.
The task: find the K most frequent search queries in a log.
For most real inputs, collections.Counter plus most_common(k) is the right answer, and saying so demonstrates judgement. Counting is one pass, and selecting the top K from the counts runs in roughly O(n log k).
When a Heap Beats Sorting
A min-heap of size K wins when K is small and the stream is long, because you never materialize the sorted list. That's O(n log k) time and O(k) space beyond the counter. If a candidate jumps straight to a heap for a 500-row list, I ask why, and "it's O(n log k)" isn't much of an answer when sorting 500 items costs nothing measurable.
- Start simple, then optimize. Get a correct Counter version working, then discuss the heap as a scaling step.
- State complexity unprompted. Time and space, plus the assumption that the counter fits in memory.
- Address the memory-bound case. A counter that can't fit in RAM needs approximate counting or external sorting, and naming that boundary matters more than the code itself.
Practice prompt: return the top 10 products by purchase count from an event stream, break ties deterministically, and explain what changes when the stream is 2 billion events spread over a week.
8. Precision, Recall and F1 Score from Scratch
The University of Virginia data science program identifies data analysis, machine learning, statistics and artificial intelligence as common technical areas, and notes recurring questions on linear and logistic regression, model evaluation, validation, and choosing between classification and regression. Metrics questions are the cheapest way for an interviewer to check whether you understand evaluation or just import it.
The task: given two lists, true labels and predicted labels, return precision, recall and F1 as a dictionary. No sklearn.
Order matters. Build the confusion matrix counts first (TP, FP, FN, TN), then derive. Precision is TP divided by TP plus FP. Recall is TP divided by TP plus FN. F1 is the harmonic mean of the two.
Zero Denominators Are the Whole Test
A model that predicts nothing positive makes precision divide by zero. Pick a convention, return 0.0, and justify it, because sklearn does the same by default and returning NaN will confuse whoever reads your output downstream.
- Connect each metric to a cost. In fraud detection, a missed case is a chargeback and a false alarm is a support ticket, so recall usually wins.
- Explain the tradeoff through the threshold. Precision and recall move in opposite directions as you shift the decision boundary.
- Mention the imbalance problem. Accuracy looks excellent on a rare-event dataset and tells you nothing useful.
What separates candidates: anyone can compute F1. The ones who get hired explain which error the business would rather make.
8 Coding Interview Questions for Data Scientist Roles at a Glance
| Question | Skill Tested | Typical Format | Difficulty Focus |
|---|---|---|---|
| Second Highest Salary (SQL Window Functions) | SQL ranking and tie handling | Query for the second-highest distinct salary or top N per group | Distinguishing ranking functions; handling ties and NULLs |
| Rolling Average and Moving Window Calculations | Time-series analysis and window functions | Calculate a rolling average in SQL or pandas | Ordering, missing dates, and partial windows |
| Conversion Rate and A/B Test Significance in Python | Python coding and statistical reasoning | Calculate conversion rates and lift, then run a two-proportion significance test | Hypotheses, p-value interpretation, and edge cases |
| Data Cleaning: Deduplication and Missing Value Handling in Pandas | Pandas data wrangling and judgment | Clean a DataFrame with duplicates, missing values, and inconsistent data | Choosing appropriate transformations and avoiding bias |
| Linear Regression with Gradient Descent from Scratch | Optimization and machine learning fundamentals | Implement linear regression with NumPy | Gradient math, learning rate, and feature scaling |
| Sessionization and User Activity Streaks | SQL or Python sequence analysis | Group timestamped events into sessions or find activity streaks | Multi-step logic, timestamp ordering, and edge cases |
| Top K Frequent Items with Hash Maps and Heaps | Algorithms, hashing, and complexity analysis | Find the K most frequent items using a counter and heap | Efficiency trade-offs and memory constraints |
| Precision, Recall, and F1 Score from Scratch | Classification metrics and evaluation | Compute confusion matrix counts and metrics from labels | Zero denominators, class imbalance, and metric trade-offs |
Your Two-Week Practice Plan and Where ParakeetAI Fits In
Two weeks is enough time to move from shaky to fluent if you sequence it properly. Days one through eight cover the eight questions above, one per day, solved cold with a timer running. Days nine through fourteen are the second pass, and this is when the score moves.
Cold solving teaches the mechanics. Re-solving while narrating every decision teaches the interview.
On the second pass, talk through your assumptions before touching the keyboard. Take the salary question and state what you're assuming about ties, write the query, then generalize it to a per-department version out loud. Take the cleaning prompt and explain why median beats mean on a skewed age column. Take the A/B test and defend your reading of the p-value in plain language.
What to skip matters too. More algorithm puzzles won't fix a candidate whose SQL is shaky, and another statistics course won't fix an explanation that trails off mid-sentence. Diagnose the failure mode first.
Practising aloud is where ParakeetAI's Mock Interview fits. It puts you against an AI interviewer that asks role-specific questions, listens to your answers, and follows up, and you can read the transcript afterwards to see exactly where your reasoning turned vague. The Question Bank lists questions real candidates were asked, grouped by company and ranked by how often they come up, which is the fastest way to find out what a specific team asks before you walk in.
Every account gets a first mock interview free, and trying it needs no credit card, so there's nothing to lose by testing whether the format suits how you think.
One more thing about pacing. Don't cram six questions into a Sunday afternoon and call it preparation. Two questions a day, each solved twice, beats that every time, because recall under pressure comes from repetition rather than from having once seen the answer.
Book your first practice session this week. Pick the skill family that scares you most, put it on the calendar, and get the reps in before the recruiter calls back.
ParakeetAI is built for exactly the moment this article is about. During a live interview it listens to the interviewer's coding questions and shows suggested answers, explanations and code on your screen in real time, drawing on your resume and the job description, and it can read a problem from a screenshot when a question appears in a shared editor. When you're not on a call, its Mock Interview and Question Bank let you rehearse the eight skill families above until the reasoning comes out smoothly, so visit ParakeetAI and start with the free mock.